p1832jfa4n8en159q1bsgci7ol75.jpg
Modern Car Key and Remote Isolated on a White Background.
Every year, Allstate actuaries compile claims data to determine the likelihood of vehicle collisions for drivers in America's 200 largest cities compared to the national average. Auto claims were analyzed from a two-year period, from January 2010 to December 2011. Allstate's ninth annual assessment of auto claims, titled "Allstate America's Best Drivers Report," also found that 70 percent of vehicles involved in auto claims are considered drivable, which indicates that most claims are the result of low-speed (less than 35 miles per hour) collisions. The following are the 10 safest cities overall for drivers based on the results, as well as the safest big cities (with populations exceeding one million people) for driving.
p1832gdegh1e9ac181iocbi9ludd.jpg
Eugene, Oregon. Red flag pin in an old map showing travel destination.

10. Eugene, Ore.

Years between collisions for the average driver: 11.9Collision likelihood compared to national average: 16.2% less likely
p1832gdegh16jqe2c1mfs1g39qkjc.jpg
State Capitol of Alabama in Montgomery.

9. Montgomery, Ala.

Years between collisions for the average driver: 11.9Collision likelihood compared to national average: 16.3% less likely
p1832gdegh15bq7sk1o3c1ca31oiab.jpg
Car Keys on California Map Showing San Francisco and Los Angeles

8. Visalia, Calif.

Years between collisions for the average driver: 12.3Collision likelihood compared to national average: 18.5% less likely
p1832gdeghqmqk44s3ru5m12ala.jpg

7. Huntsville, Ala.

Years between collisions for the average driver: 12.5Collision likelihood compared to national average: 20.1% less likely
p1832gdegh9521147gvo164s1ui49.jpg
Reno The Biggest Little City in the World.

6. Reno, Nev.

Years between collisions for the average driver: 12.5Collision likelihood compared to national average: 20.2% less likely
p1832gdegg4g13isk89b5dhr8.jpg

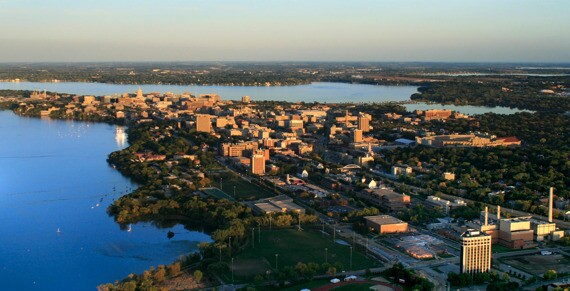
5. Madison, Wis.

Years between collisions for the average driver: 12.5Collision likelihood compared to national average: 20.3% less likely
p1832kehqqlpifl81s4ak041e6g5.jpg

4. Brownsville, Texas

Years between collisions for the average driver: 12.7Collision likelihood compared to national average: 21.1% less likely
p1832gdeggkcn17045ak1hnn1sde7.jpg

3. Sioux Falls, S.D.

Years between collisions for the average driver: 12.8Collision likelihood compared to national average: 21.8% less likely
p1832gdeggh81vcm1pmv146rc0b6.jpg
Dramatic clouds over the Idaho capital in Boise Idaho

2. Boise, Idaho

Years between collisions for the average driver: 13.9Collision likelihood compared to national average: 28.0% less likely
p1832gdegfip7oun4j217787ec5.jpg
Walnut & Linden Streets, Fort Collins (inspired Disneyland's Main St. USA), New York

1. Fort Collins, Colo.

Years between collisions for the average driver: 13.9Collision likelihood compared to national average: 28.2% less likely Allstate also ranked the safest cities with populations of more than one million people:
p1832gdegi1nod1j24ch21hkv4k9i.jpg
view of downtown houston framed cars light on highway

5. Houston, Texas (151 overall)

Years between collisions for the average driver: 8.0Collision likelihood compared to national average: 25.6% more likely
p1832gdegi163r17jg3jg193i1s3vh.jpg

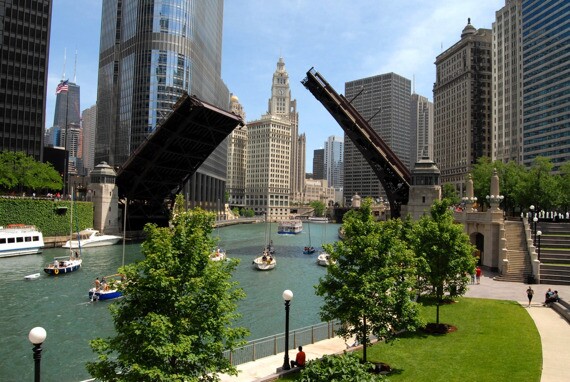
4. Chicago, Ill. (150 overall)

Years between collisions for the average driver: 8.0Collision likelihood compared to national average: 25.2% more likely
p1832gdegij9s1jj51v3c1qn41ubeg.jpg
San Antonio, Texas, the way we looked at it in 1949

3. San Antonio, Texas (141 overall)

Years between collisions for the average driver: 8.2Collision likelihood compared to national average: 22.4% more likely
p1832gdegilpj33916rhqnsnfof.jpg
Skyline of San Diego, California on a bright sunny day.

2. San Diego, Calif. (127 overall)

Years between collisions for the average driver: 8.7Collision likelihood compared to national average: 14.6% more likely
p1832gdegh5baec7gfu7i0912e.jpg
Long exposure photo of the a city street in downtown Phoenix, Arizona at night.

1. Phoenix, Ariz. (71 overall)

Years between collisions for the average driver: 9.8Collision likelihood compared to national average: 2.0% more likely